No matter what side of the fence you were on during this election, we all know things got pretty, uh, interesting. And, while we don’t have the finalized ad spend for this years’ political circus, we do have YOUR data. So, regardless of how much money was dumped into bashing “Crooked Hillary” or hating on Trump’s plans to “Make America Great Again” – we know how it ended up affecting your KPIs.
As usual, we took The Camel Client (our group of consistent, data-accurate clients & markets) and did some number crunching. We compared a few key metrics: your broadcast TV clearance rate, your weekly AA calls, and your monthly cost per call.
As we saw in my last political blog, decreasing your budget during this season has proven NOT to be the answer. All clients involved in this study stayed true to the course of their original broadcast TV budget. So, how did that end up actually panning out?
Quite well, I’d say.
First: clearance rate. We all knew your spots would get bumped in November, and we were right. Our media buyers bust their humps on a daily basis to ensure TV stations are being held accountable for any pre-emptions that might happen to your schedules. Unfortunately, politicians have deep pockets, so we have to deal with the wrath of their spending. However, looking at November, the clearance rate was still only 6% lower overall vs. the year average. Some markets were definitely hit harder than others, but our media buying experts worked through market-specific problems and made sure the reps knew what they had to do to make those pre-emptions good again.
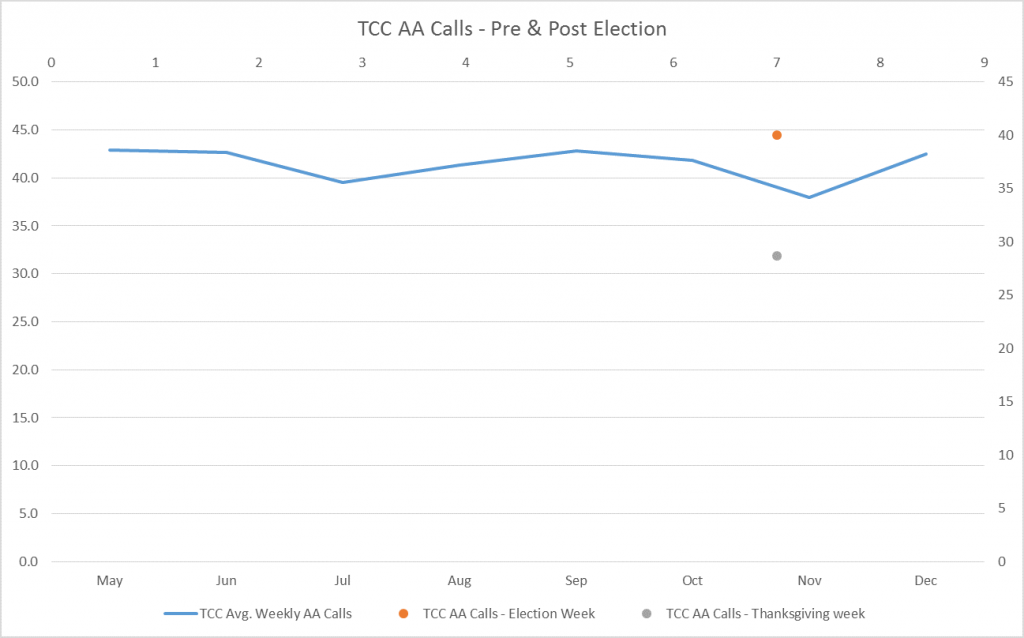
So, your clearance was a bit down. What about calls?
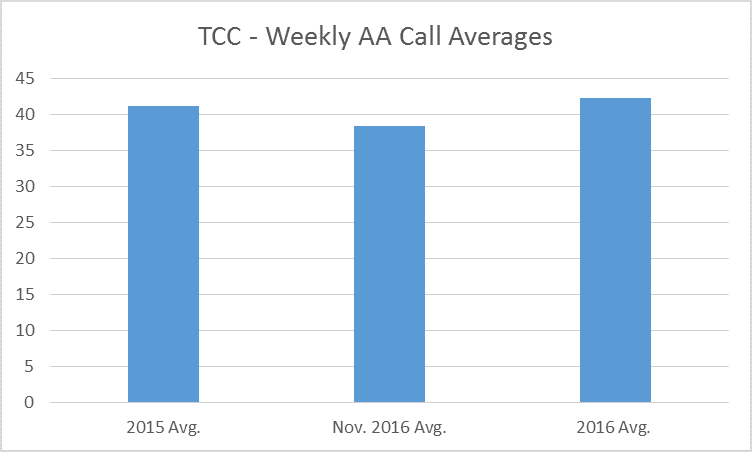
Doesn’t look too bad, does it? It’s not. While calls dipped by an average of 8.8% compared to the 2016 average, 2016 ended at a higher average weekly AA call rate than 2015, and 2015 wasn’t even a major political year. Thanksgiving had a bigger effect on calls than political. And, the best part of it all? Right after the hubbub of it all was over – calls rebounded and raised above the yearly average. The first 3 weeks of December (pre-holidays), calls were up by an average of 5%.
That brings us to the last metric: cost per call. However, based on what has already been shown – both calls and spending dropping by (about) the same rate – it turns out cost per call barely suffered. Novembers cost per call was only up 2% compared to the 2016 average.
The political season may have taken a toll on some, but thanks to our buyers, your media & calls were taken care of!